


August was a reminder that markets can perform well even when conditions are not perfect. Uncertainty around oil prices, Federal Reserve (the central bank of the United States) decisions, new tariffs on global trade, and interest rates at their highest levels in decades all remained in the background. Even so, many positive forces pushed major stock market indexes upward.
For everyday investors, the key lesson is that short-term concerns are a normal part of investing. History shows that portfolios built around long-term goals give investors the best chance at financial success, rather than trying to react to every challenge as it comes. With that in mind, here is a look at what moved markets in August and what investors should think about going forward.
Key Market and Economic Highlights for August
• The S&P 500 (a broad measure of large U.S. stocks), Nasdaq (a tech-heavy stock index), and Dow Jones Industrial Average (an index of 30 major U.S. companies) rose 2.6%, 3.9%, and 1.3%, respectively, in August. Year-to-date, they have gained 12.3%, 13.5%, and 10.7%, respectively.
• Market volatility, as measured by the CBOE VIX index (a gauge of how much investors expect stock prices to swing), dropped below its long-term average, ending the month at 16 after climbing as high as 21 the previous month.
• International developed markets returned 1.8% based on the MSCI EAFE Index in U.S. dollar terms, while emerging markets (faster-growing economies like those in Asia and Latin America) returned 3.2% based on the MSCI EM Index.
• The 30-year Treasury yield (the interest rate on long-term U.S. government bonds) reached its highest level since 2007, closing the month at 5.24%. The 10-year Treasury yield ended the month at 4.75%. The Bloomberg U.S. Aggregate Bond Index, a broad measure of U.S. bonds, returned 0.4% for the month.
• Oil prices held steady in a range in August after climbing the previous month. Brent crude closed the month at $90.68 per barrel and WTI near $86.27 per barrel.
• The U.S. Dollar Index fell to 99.43 at the end of August. Gold ended the month at $4,437.38 per ounce while silver rose to $66.58 per ounce.
• The revision to second quarter GDP (Gross Domestic Product, a measure of total economic output) remained unchanged at an annual rate of 1.5%.
• The July jobs report missed expectations with a decline of -23,000 in payrolls compared to a forecasted gain of 80,000. Unemployment fell slightly to 4.1%.
Long-term interest rates are close to their highest levels in a generation
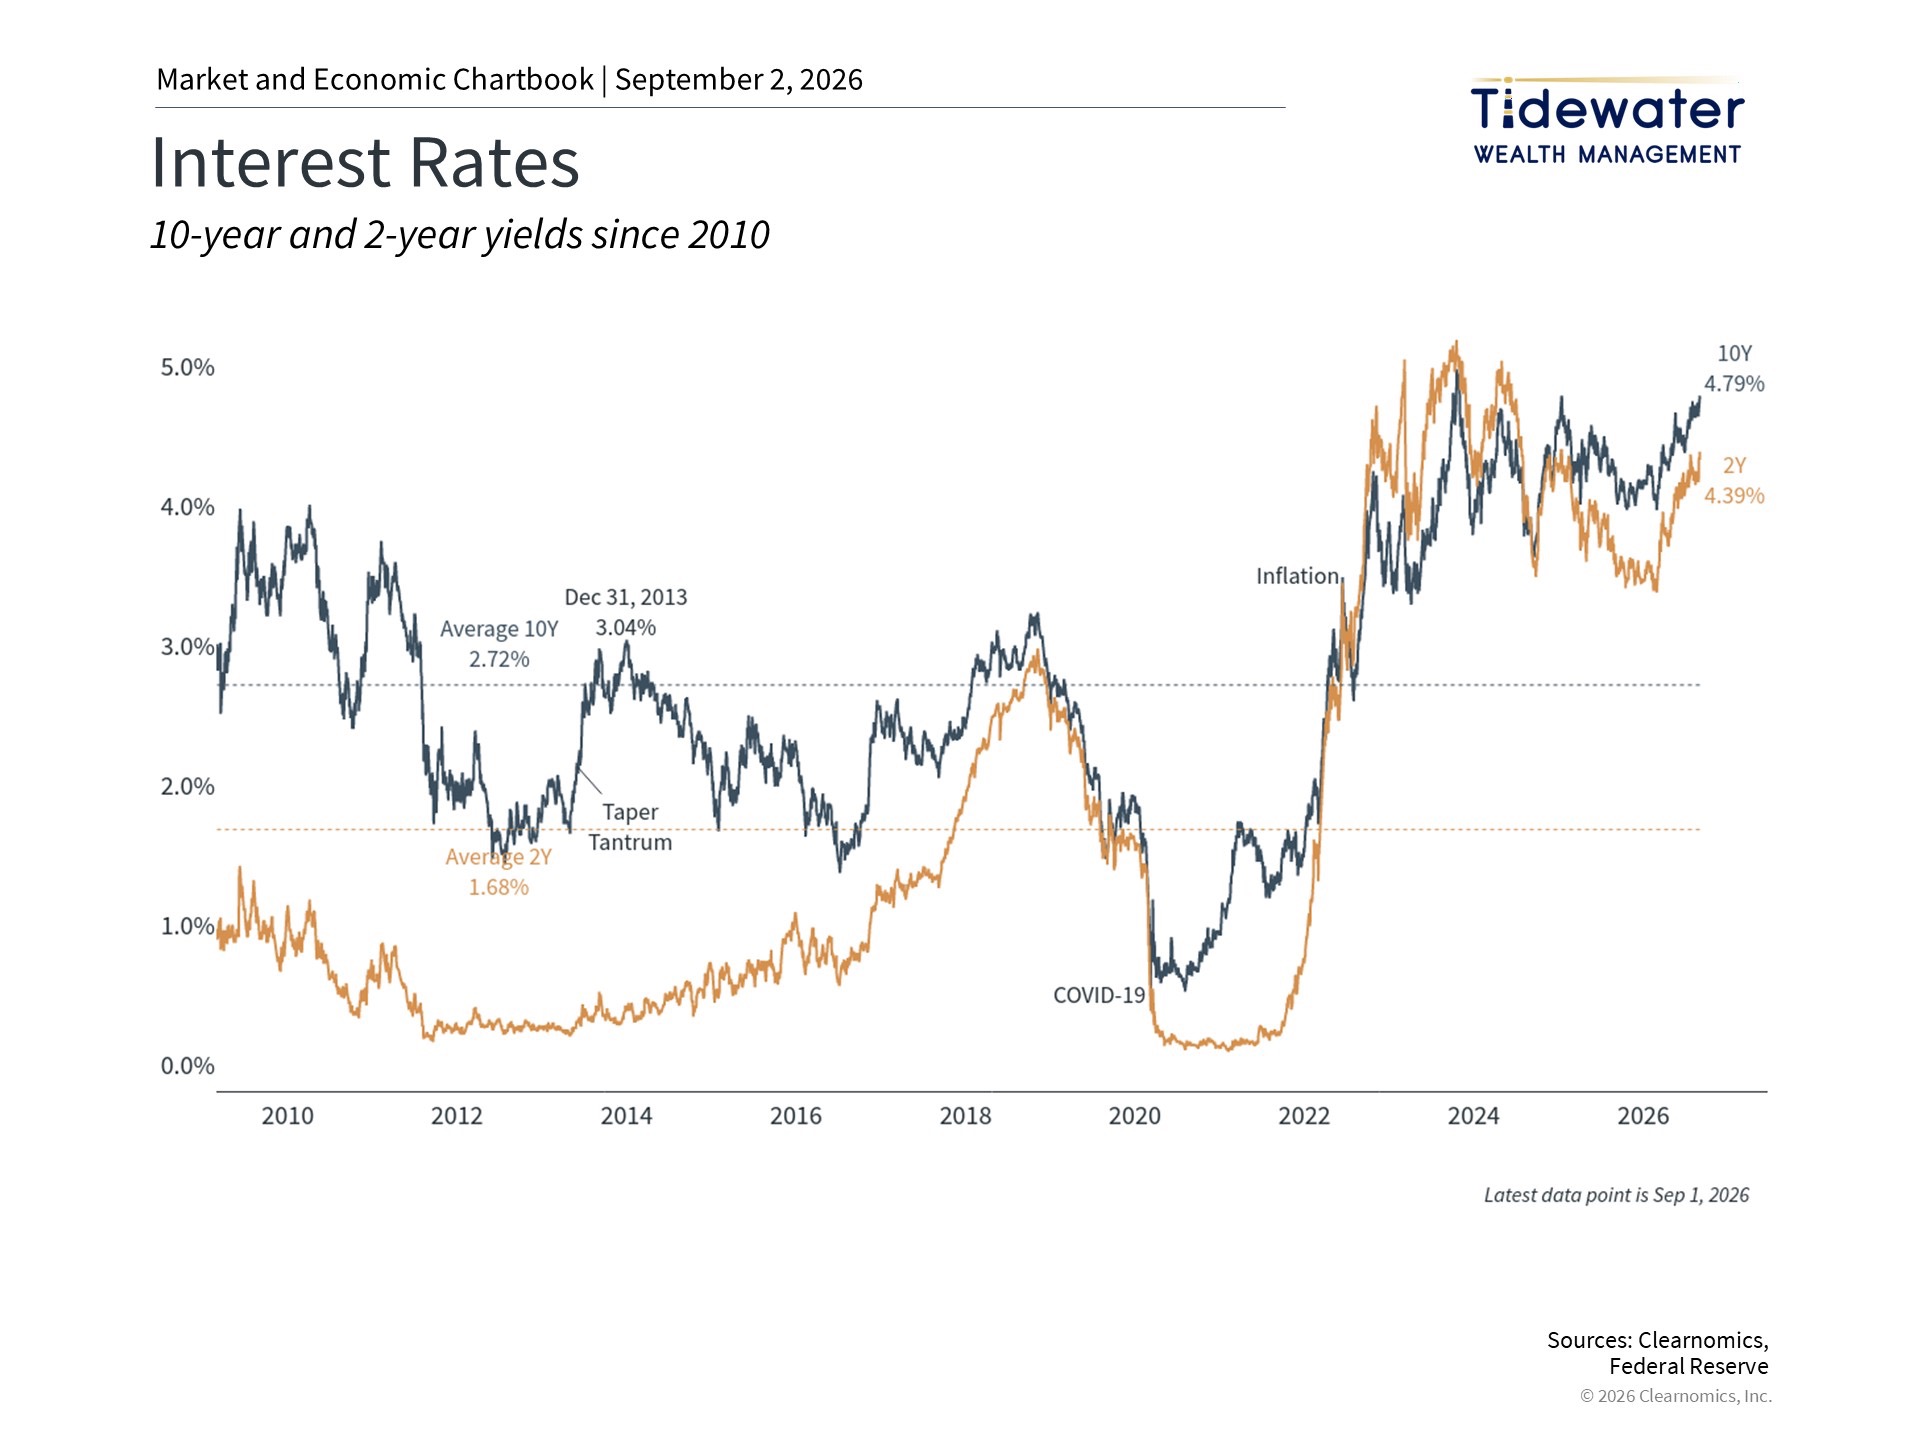
One of the most important features of today’s investing environment is that interest rates have stayed higher than most people expected. The 30-year Treasury yield briefly went above 5.3% in August, a level not seen in almost 20 years. Likewise, the 10-year Treasury yield, around 4.8%, is close to its recent peak.1 Interest rates may sound like a technical topic, but they both shape and reflect the health of the economy.
Higher rates are often seen as a negative for markets, but the reason rates are rising matters a great deal. While inflation pushed rates higher in recent years, more recent increases have been driven by improved “real yields,” meaning bond yields after adjusting for inflation. This reflects a healthy economy, supported in particular by strong corporate earnings. Over the long run, this is a positive signal, which helps explain why both interest rates and the stock market are near their peaks at the same time.
Looking ahead, higher rates can also benefit long-term investors by creating more income from bond holdings. At the same time, rising rates push down the prices of existing bonds, which is why major bond indexes like the Bloomberg U.S. Aggregate Bond Index have been roughly flat this year. It is important to think about rising rates in the context of a well-balanced portfolio and your own financial goals.
Inflation still remains higher than consumers and policymakers would prefer. The headline Personal Consumption Expenditures Price Index (a widely followed measure of what Americans pay for goods and services) showed inflation at 3.7% year-over-year in July, while core PCE (which strips out food and energy) rose 3.3%, both well above the Fed’s 2% target.2 At the Fed’s annual Jackson Hole symposium in late August, Fed Chair Kevin Warsh signaled that a rate hike could arrive sooner. As a result, markets are now pricing in at least one rate increase this year, and possibly two by early next year.3
Corporate earnings are growing broadly across many sectors
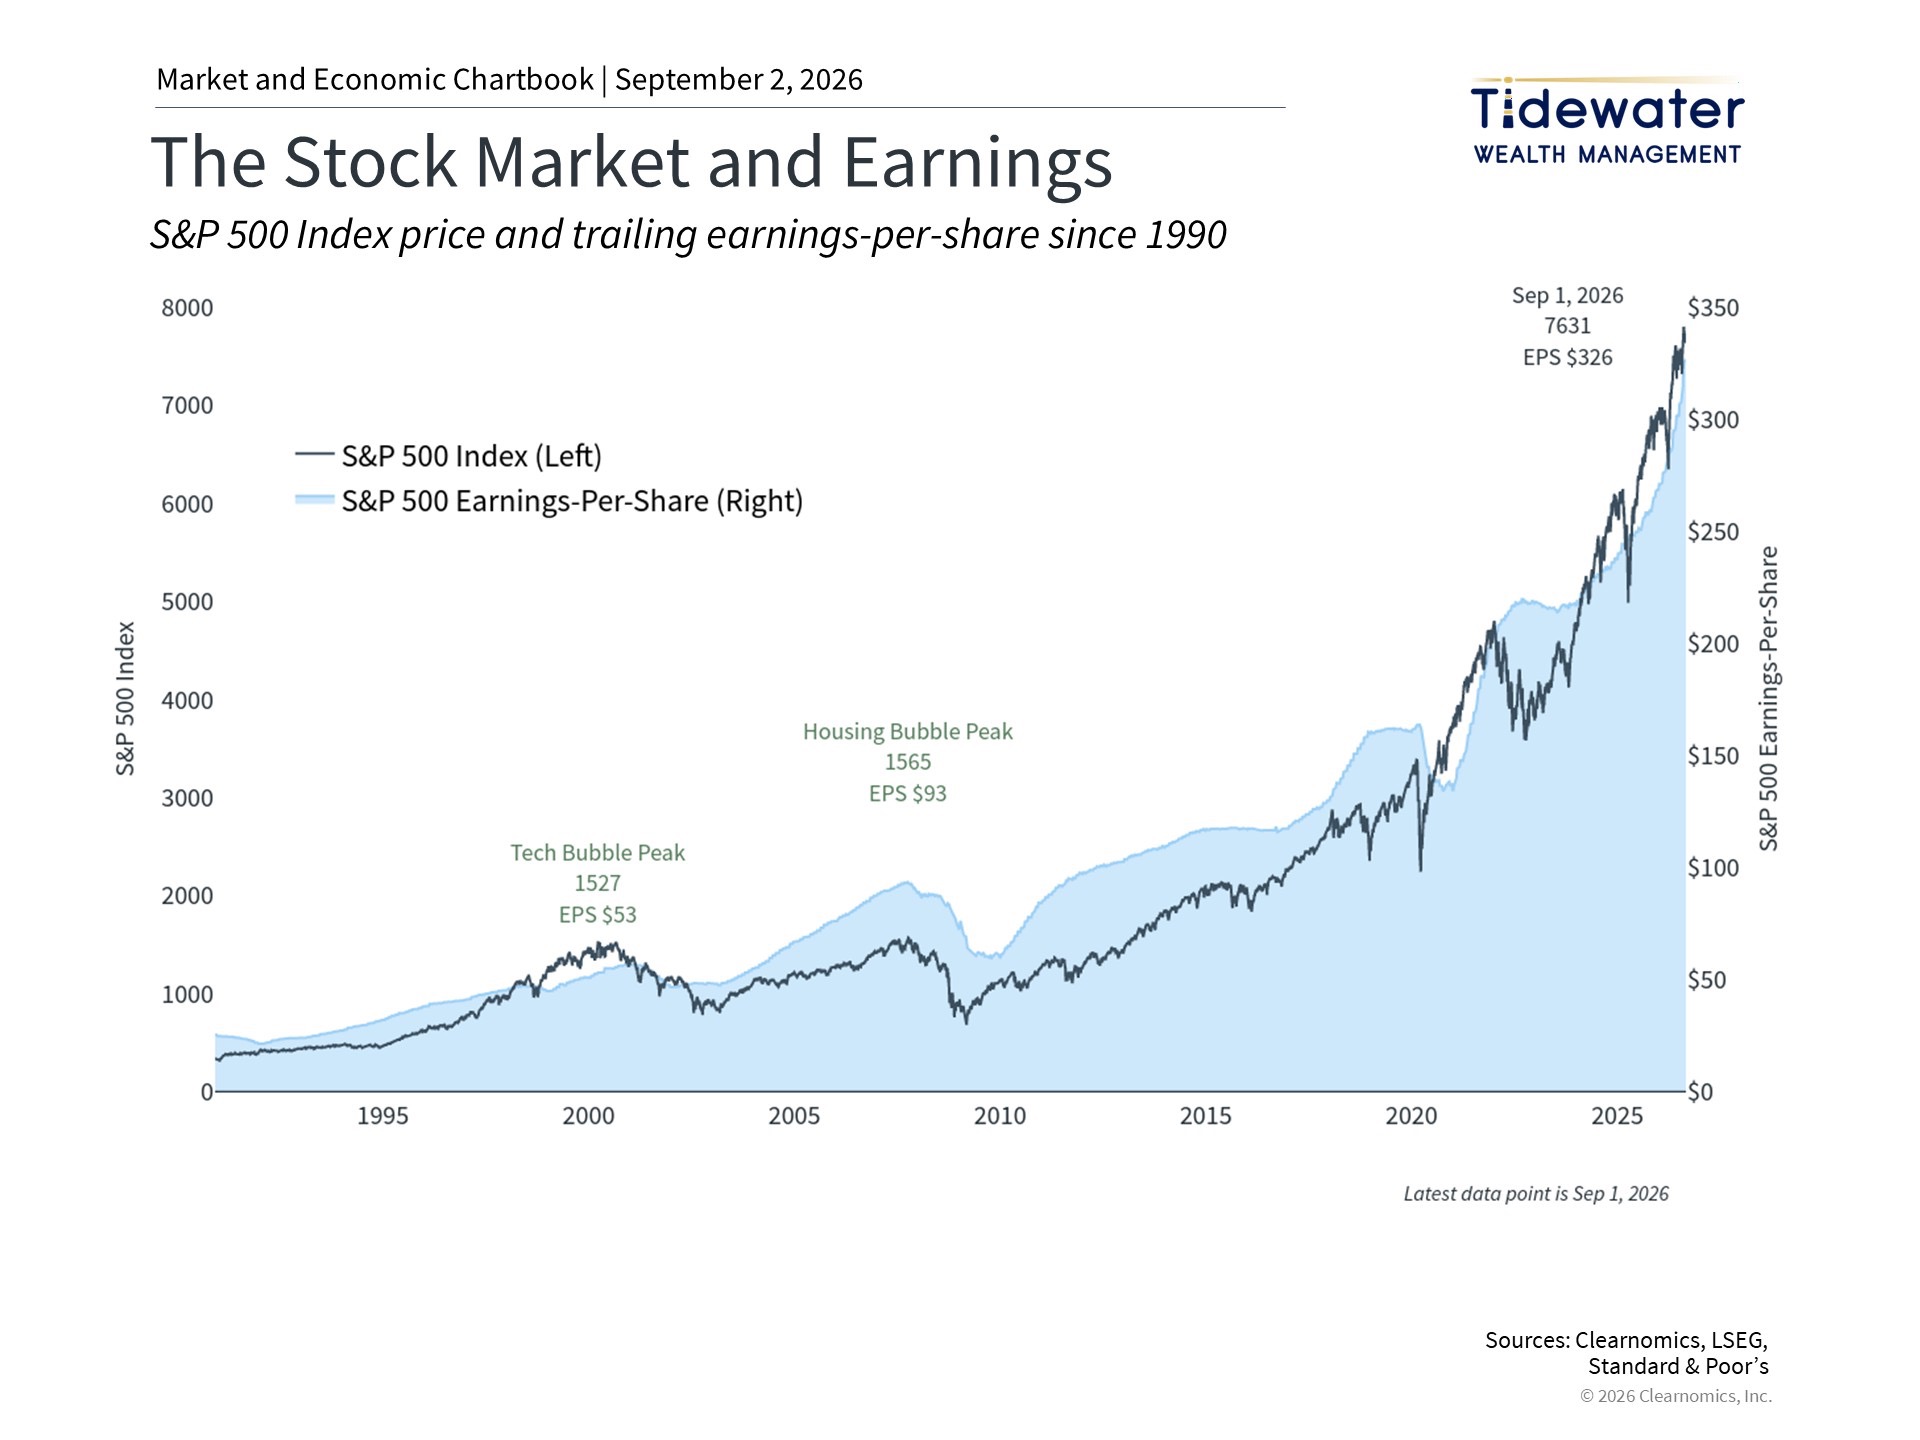
The S&P 500 reached new all-time highs in August, fueled largely by strong corporate earnings (the profits that companies report). Results for the second quarter came in well above expectations across many sectors, and analysts now expect S&P 500 earnings to reach $349 per share by year-end. Forecasts also call for earnings-per-share growth of 15% in each of the next two years, which is well above the historical average of 7%.4
While these forecasts can always change, they reflect growth driven by investment in artificial intelligence infrastructure, higher oil prices, and healthy activity across many parts of the economy. Specifically, ten of the eleven S&P 500 sectors reported year-over-year earnings growth, with nine reporting double-digit percentage gains. This breadth of growth suggests that the overall economy, not just a handful of large companies, is contributing to corporate profits.5
Strong corporate earnings are one reason that stock market valuations (how expensive stocks are relative to company profits) have stayed steady over the past year. The S&P 500 price-to-earnings ratio has hovered around 20x, which is above the historical average of 16x but an improvement from recent peaks. While valuations do not predict short-term market moves, they are useful guides for building a long-term portfolio. In a higher-valuation environment, staying balanced across sectors, asset types, and regions remains especially important.
Trade tensions continue to create uncertainty for global markets
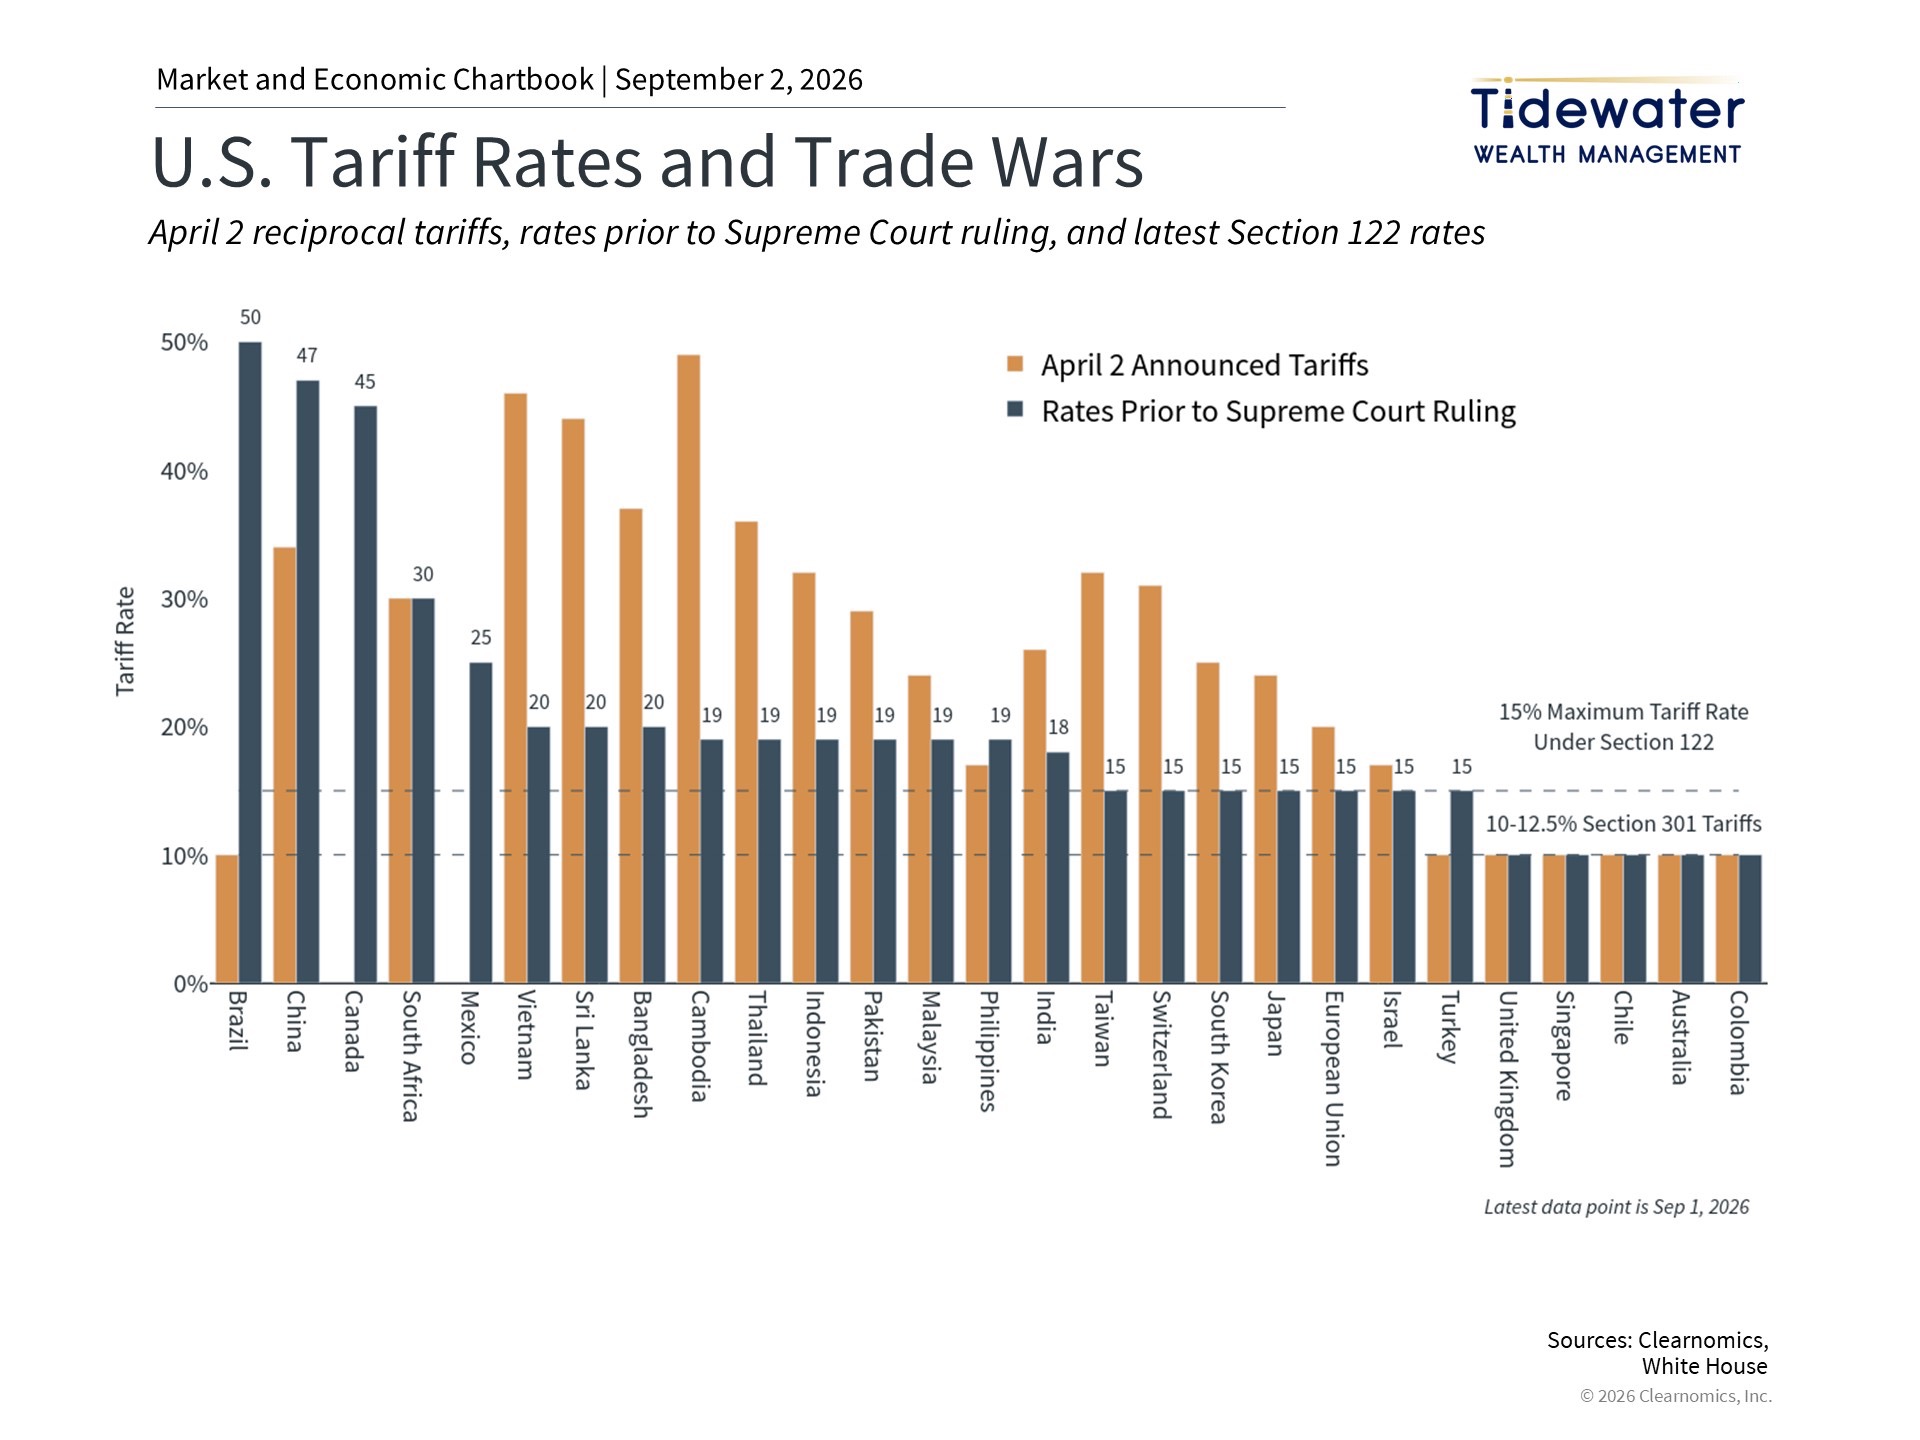
Trade policy was back in the news in August as tensions with key trading partners such as Canada increased. After last year’s “Liberation Day” tariffs (fees on imported goods) were ruled illegal by the Supreme Court in February, new tariffs were put in place under different laws, such as Section 301 of the Trade Act of 1974. Those tariffs have since expired and been replaced by new ones under other trade laws, each with their own rules. At the same time, the government is now refunding the original “reciprocal tariffs” to businesses, with $129 billion already accepted for processing by U.S. Customs and Border Protection.6
As has been the case since early last year, the worst-case outcomes that many investors and economists feared have not come to pass. This is largely because companies have adapted their supply chains, adjusted their pricing, and managed costs in response to tariffs, which has limited the impact on inflation from higher input costs. Even so, tariffs will likely remain a source of uncertainty for global markets in the years ahead.
The bottom line? August showed the value of staying balanced and not overreacting to headlines. Despite periods of volatility, strong corporate earnings and attractive bond yields continue to support long-term portfolios.
References
1. https://home.treasury.gov/policy-issues/financing-the-government/interest-rate-statistics
2. https://www.bea.gov/news/2026/personal-income-and-outlays-july-2026
3. https://www.cmegroup.com/markets/interest-rates/cme-fedwatch-tool.html
4. Clearnomics research and LSEG data as of August 31, 2026
5. https://insight.factset.com/sp-500-earnings-season-update-august-7-2026
6. https://www.cbp.gov/trade/programs-administration/trade-remedies/ieepa-duty-refunds
Index Descriptions
S&P 500
The Standard & Poor’s 500 Index is a capitalization-weighted index of 500 stocks designed to measure performance of the broad domestic economy through changes in the aggregate market value of 500 stocks representing all major industries.
Dow Jones
The Dow Jones Industrial Average consists of 30 stocks that are major factors in their industries and widely held by individuals and institutional investors.
NASDAQ
The NASDAQ Composite Index measures all NASDAQ domestic and non-U.S. based common stocks listed on The NASDAQ Stock Market. The market value, the last sale price multiplied by total shares outstanding, is calculated throughout the trading day, and is related to the total value of the Index.
MSCI Emerging Markets Index
The MSCI EM (Emerging Markets) Index is a free float-adjusted market capitalization weighted index that is designed to measure the equity market performance of the emerging market countries of the Americas, Europe, the Middle East, Africa and Asia. The MSCI EM Index consists of the following emerging market country indices: Brazil, Chile, Colombia, Mexico, Peru, Czech Republic, Egypt, Greece, Hungary, Poland, Qatar, Russia, South Africa, Turkey, United Arab Emirates, China, India, Indonesia, Korea, Malaysia, Philippines, Taiwan, and Thailand.
MSCI EAFE Index
The MSCI EAFE Index is a free float-adjusted market capitalization index that is designed to measure the equity market performance of developed markets, excluding the US & Canada. The MSCI EAFE Index consists of the following developed country indices: Australia, Austria, Belgium, Denmark, Finland, France, Germany, Hong Kong, Ireland, Israel, Italy, Japan, the Netherlands, New Zealand, Norway, Portugal, Singapore, Spain, Sweden, Switzerland and the UK.
Bloomberg US Aggregate Bond Index
The Bloomberg U.S. Aggregate Bond Index is an index of the U.S. investment-grade fixed-rate bond market, including both government and corporate bonds.
DXY
The DXY is a U.S. dollar index based on a basket of currencies, including the Euro, Yen, Pound, Canadian Dollar, Swedish Krona and Swiss Franc.