


The stock market has reached new all-time highs after going through several uncertain periods this year. This is good news for investors, especially because many different parts of the market have helped push prices higher, including sectors such as Energy, Information Technology, and Industrials. Interest rates are also near their highest levels in many decades, which means bonds are now offering some of the best returns in years. That said, investors should always be ready for periods of ups and downs, which recent years have shown can happen at any time.
For investors focused on the long term, rising stock prices and higher bond yields create a situation that calls for a careful mix of investments in a portfolio. It might seem strange that stocks can hit record highs while interest rates stay elevated, since high rates can slow down the economy. However, when both stocks and bonds are supported by positive trends, a well-balanced portfolio can help investors reach their financial goals. So how should investors think about their portfolios when markets are near record levels?
Stocks and bonds each support a portfolio in their own way
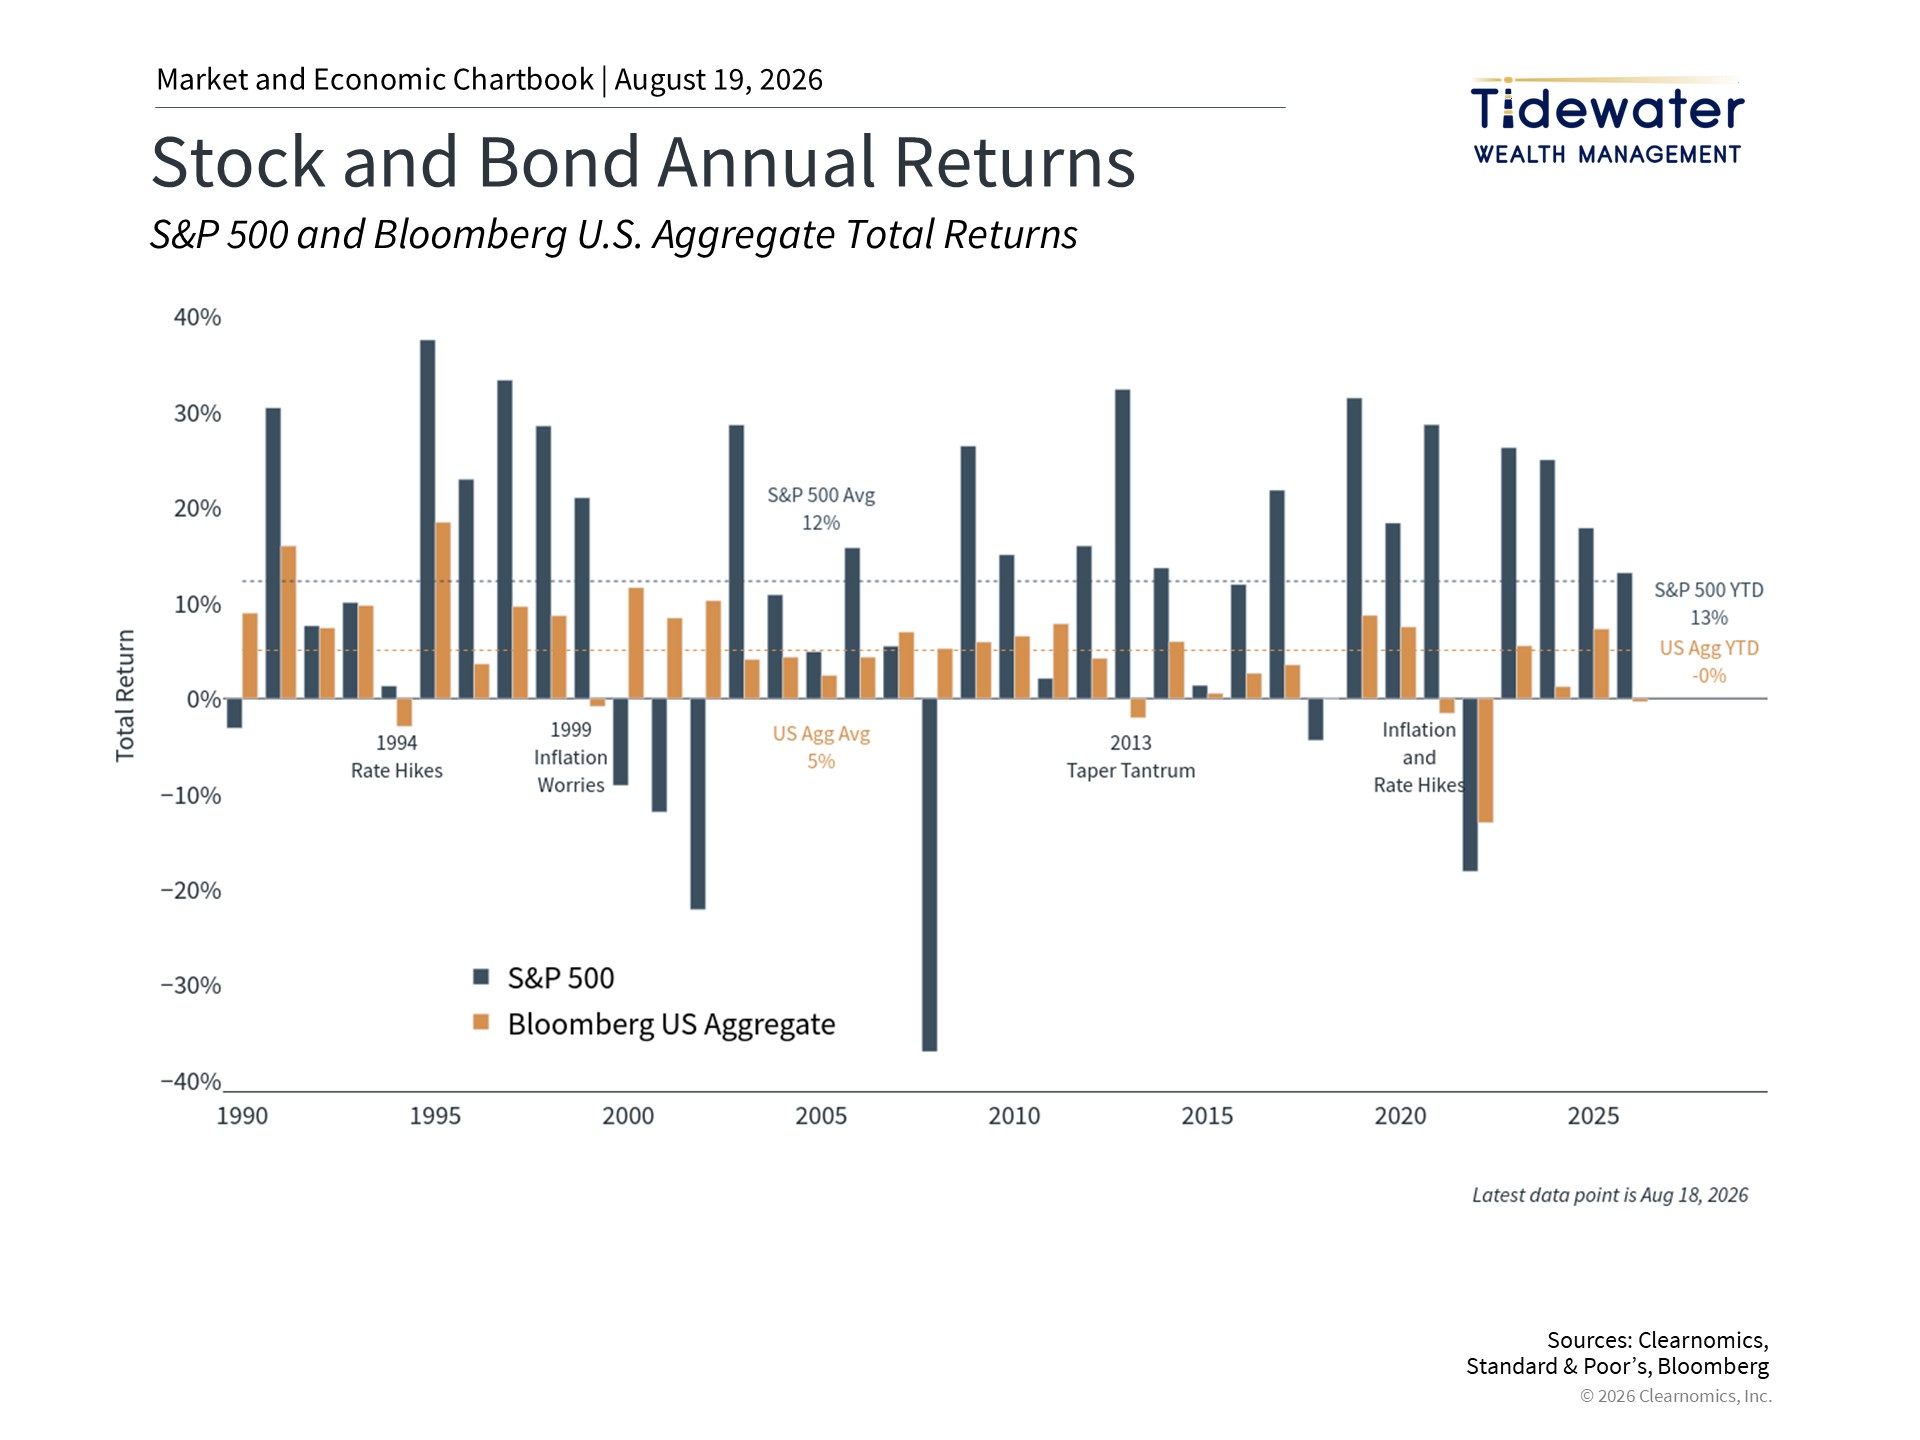
The S&P 500, Nasdaq, and the Dow Jones Industrial Average have all delivered double-digit total returns so far this year.1 Several important themes are shaping which parts of the market have driven these gains. The most talked-about are that artificial intelligence continues to lift technology stocks, and the energy sector has been helped by higher oil prices. These are the factors most often mentioned in financial news, and they help explain why major market indexes have climbed to new highs.
Another key driver is that company earnings, meaning the profits businesses make, have grown at a remarkable pace, giving the rally a solid foundation. Over the long run, a growing economy helps companies earn more money, which then pushes their stock prices higher. Notably, company profits have jumped significantly in recent years even though the overall economy has grown only modestly. Current forecasts suggest that the S&P 500 could reach an earnings-per-share figure of $347 this year, which would represent an annual growth rate of over 30%. If achieved, this would be well above the historical average of around 8%.2
There is also another important force behind the recent S&P 500 rally: the Federal Reserve (the Fed) and interest rates. In the short term, markets can be very sensitive to what investors expect the Fed to do with rates. This is because interest rates affect how much investors are willing to pay for stocks today based on the money those companies are expected to earn in the future. Since oil prices started rising earlier this year, markets expected the Fed to raise rates to keep inflation in check. More recently, with signs of a cooling job market and steady inflation, those expectations have faded, with only one small rate increase of a quarter of a percentage point expected by next January.
Understanding how rising rates affect both stocks and bonds depends on why rates are rising in the first place. When rates go up because of inflation worries, they can hurt both stocks and bonds, as happened in 2022 when the Fed raised rates aggressively to fight inflation. But rates can also rise because the economy is expected to grow more strongly. This pushes up what are called “real rates,” which are interest rates after accounting for inflation.3 Higher real rates can support stock prices through stronger company earnings, while also giving bond investors better returns.
This helps explain why stocks have kept climbing even as rates have stayed high. The chart above shows how stocks and bonds have performed together over the past few decades, including long stretches where both have done well during periods of economic growth. For investors, the takeaway is not to try to predict where markets or rates are headed, but to hold a portfolio that can take advantage of the strengths of each asset type.
Waiting for a market dip before investing often backfires
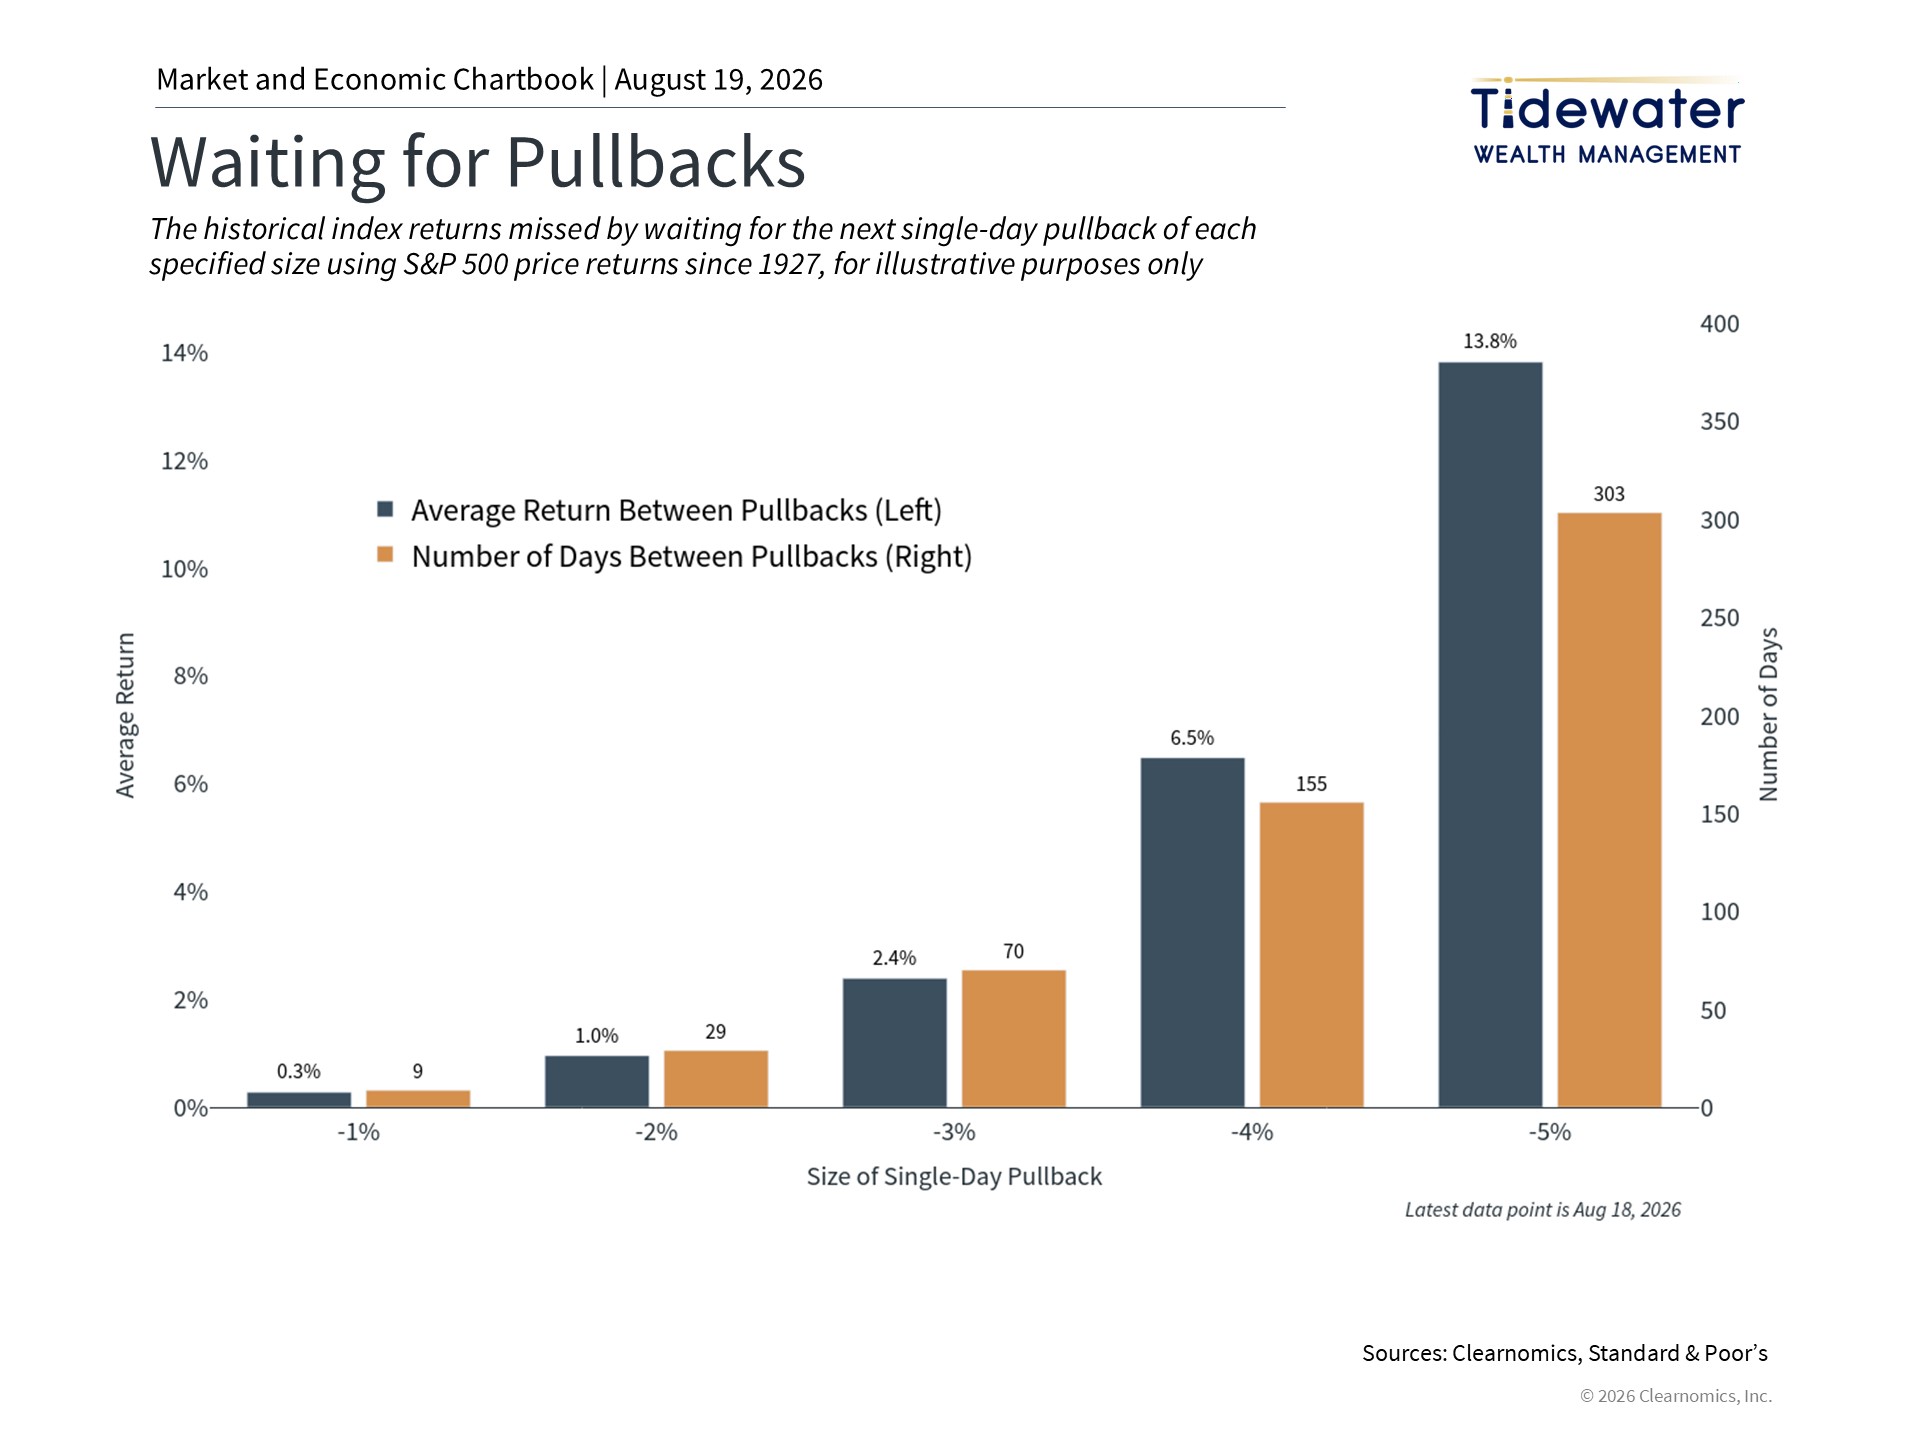
With markets near all-time highs, many investors wonder whether they should adjust their portfolios or wait for prices to drop before putting money in. History shows that because the economy and markets tend to grow over time, trying to time these movements can work against investors. The cost of sitting on the sidelines is often greater than simply getting invested.
The chart above illustrates why waiting for the perfect moment to invest often does not pay off. For example, an investor who waited for a 5% drop before putting money in would have waited an average of 291 days. During that time, the market would have already gained nearly 14%. So while drops of 5% or more do happen from time to time, the fact that markets tend to rise over the long run means the next low point is often higher than the last one. In many cases, the investor who waited would have been better off simply staying invested from the beginning.
This does not mean markets always go up, or that drops never happen. Rather, it reinforces the idea that reaching new all-time highs is a normal part of a bull market (a period when prices are rising), and that holding a well-built portfolio over time is often the best path to reaching long-term financial goals.
There are also other strategies available for investors who need to improve how their money is spread across different investments. For those who need to invest a large sum of money at current price levels, an approach like dollar-cost averaging can be useful. This means investing a fixed amount at regular intervals rather than all at once, which can help reduce the impact of short-term price swings. Spreading a portfolio across different sectors, styles, and regions can also help lower exposure to areas of the market where prices are high, while still allowing investors to benefit from potential growth.
Bond yields play a key role in long-term fixed income returns
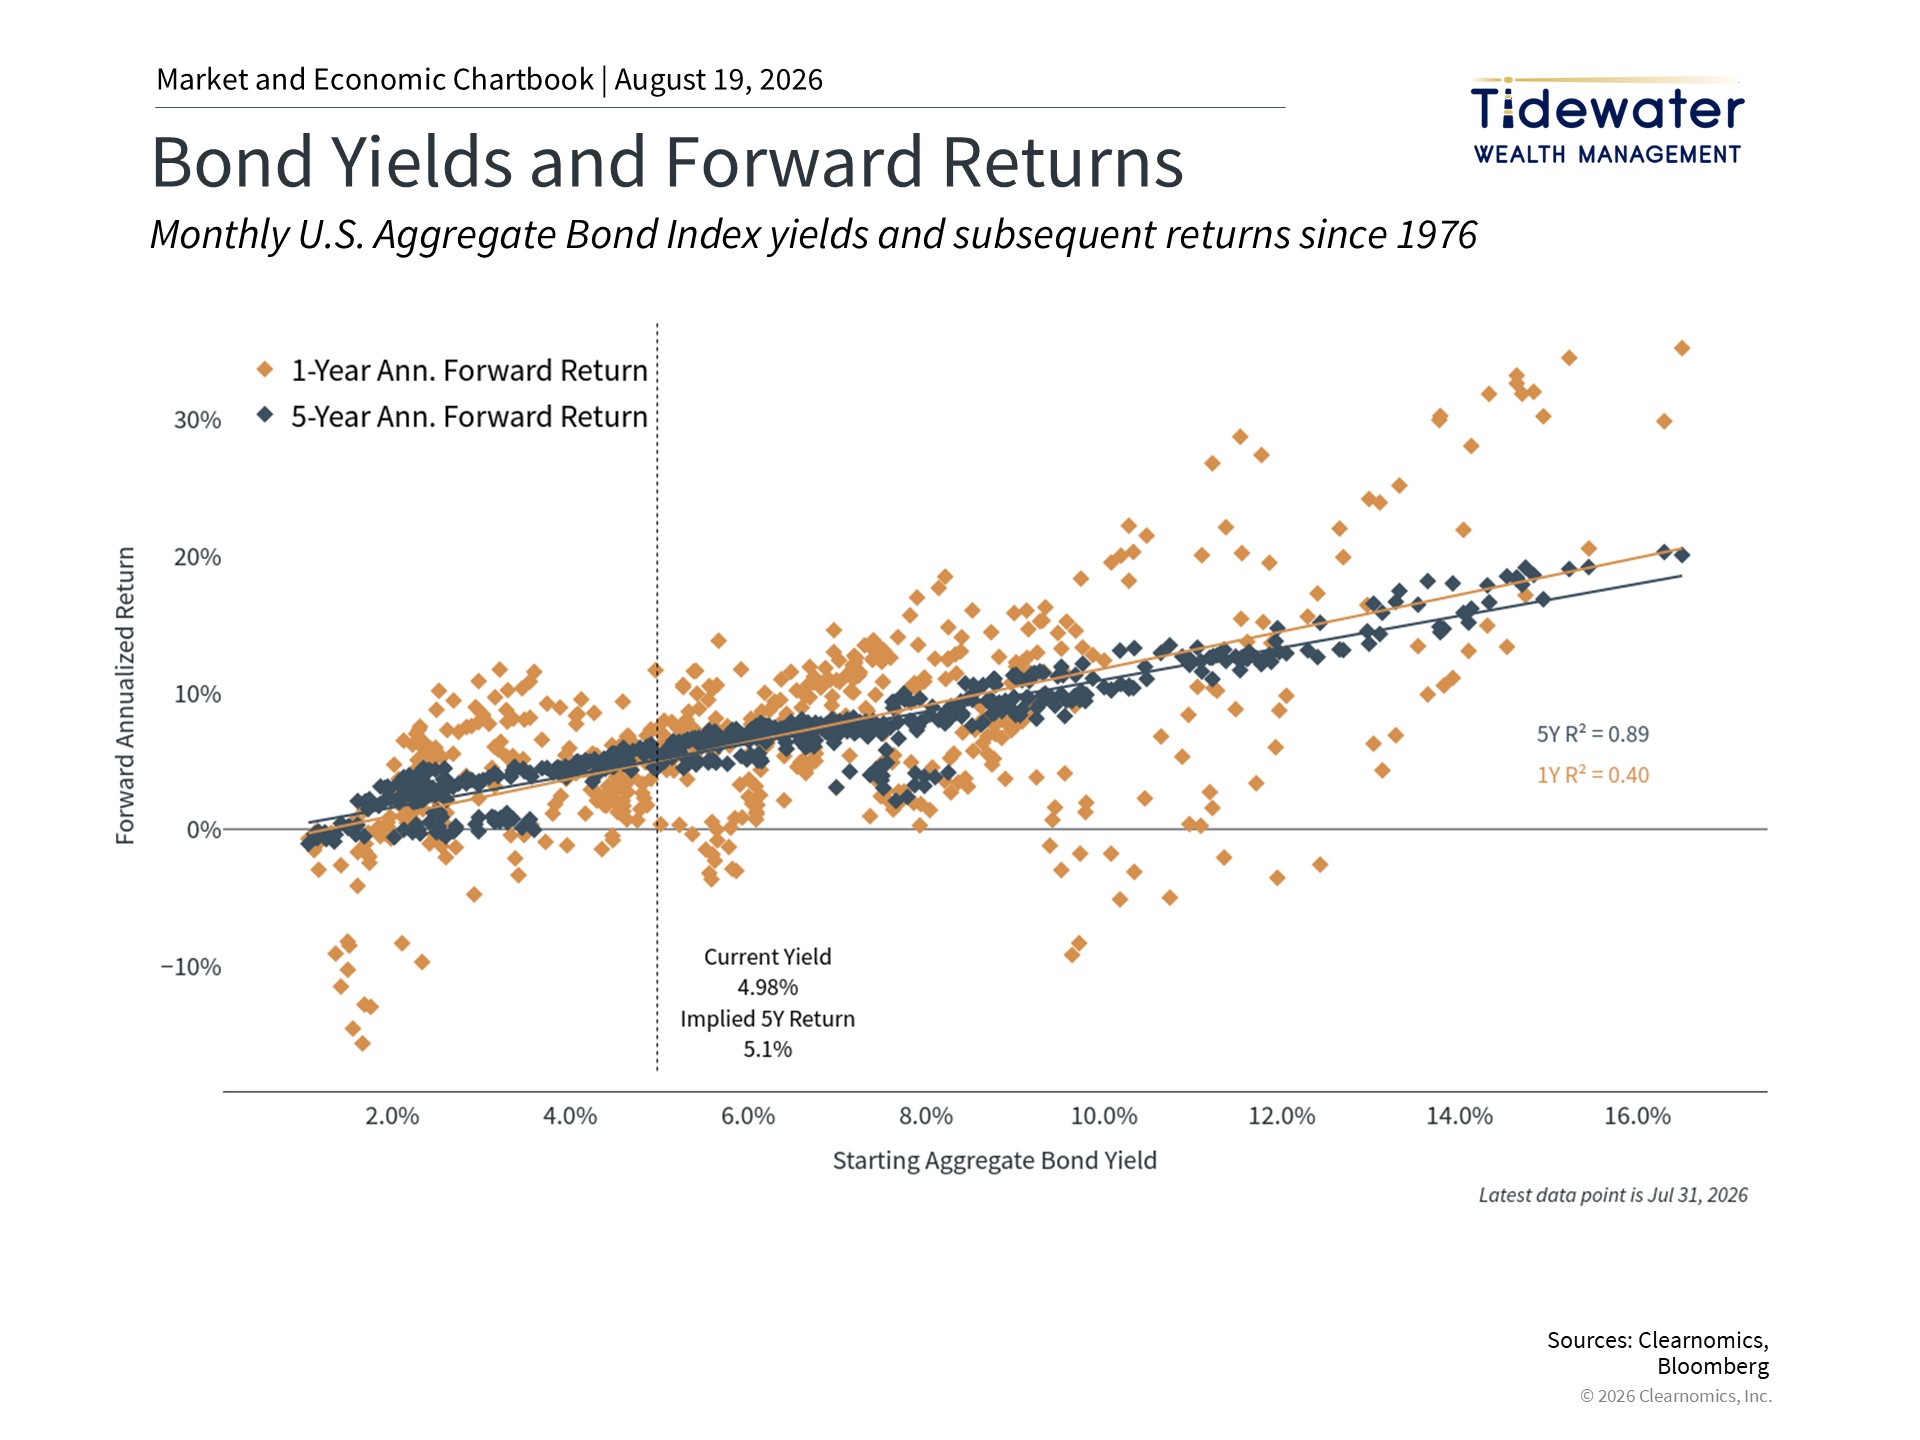
While stocks have performed well this year, bonds have been relatively flat because of rising interest rates. Bond prices and yields move in opposite directions, meaning that when rates go up, the value of existing bonds goes down. However, higher rates also mean that investors can buy new bonds that pay more income, or adjust their portfolios to take advantage of better yields, if that fits their financial plans.
The chart above shows that the yield on a bond when you first buy it is a strong indicator of the long-term return you can expect. Right now, bond yields have rarely been this attractive over the past twenty years. High-quality corporate bonds and U.S. government bonds (called Treasuries) are now paying income levels that were hard to find in the years after the global financial crisis, when interest rates were kept near zero.4 For investors who depend on their portfolios for regular income, or who want to balance out the risk that comes with owning stocks, this means there are more appealing options in bonds than there have been in a long time.
So while higher interest rates can reduce the value of existing bonds, they also mean that bonds can play a more meaningful role in a portfolio. When you combine this with the stock market trends that have benefited investors this year, both of these asset types can help long-term investors work toward their financial goals.
The bottom line? Stocks have benefited from growth trends while bond yields are historically attractive, creating opportunities across both asset classes. For long-term investors, maintaining a balanced portfolio is the best way to benefit from this environment while staying focused on financial goals.
References
1. Standard & Poor's and Nasdaq as of August 14, 2026
2. Clearnomics research using Standard & Poor's and LSEG data, as of August 14, 2026
3. https://home.treasury.gov/resource-center/data-chart-center/interest-rates
4. Clearnomics research and Bloomberg data, as of August 14, 2026
Index Descriptions
S&P 500
The Standard & Poor's 500 Index is a capitalization-weighted index of 500 stocks designed to measure performance of the broad domestic economy through changes in the aggregate market value of 500 stocks representing all major industries.
Dow Jones
The Dow Jones Industrial Average consists of 30 stocks that are major factors in their industries and widely held by individuals and institutional investors.
NASDAQ
The NASDAQ Composite Index measures all NASDAQ domestic and non-U.S. based common stocks listed on The NASDAQ Stock Market. The market value, the last sale price multiplied by total shares outstanding, is calculated throughout the trading day, and is related to the total value of the Index.
Bloomberg US Aggregate Bond Index
The Bloomberg U.S. Aggregate Bond Index is an index of the U.S. investment-grade fixed-rate bond market, including both government and corporate bonds.